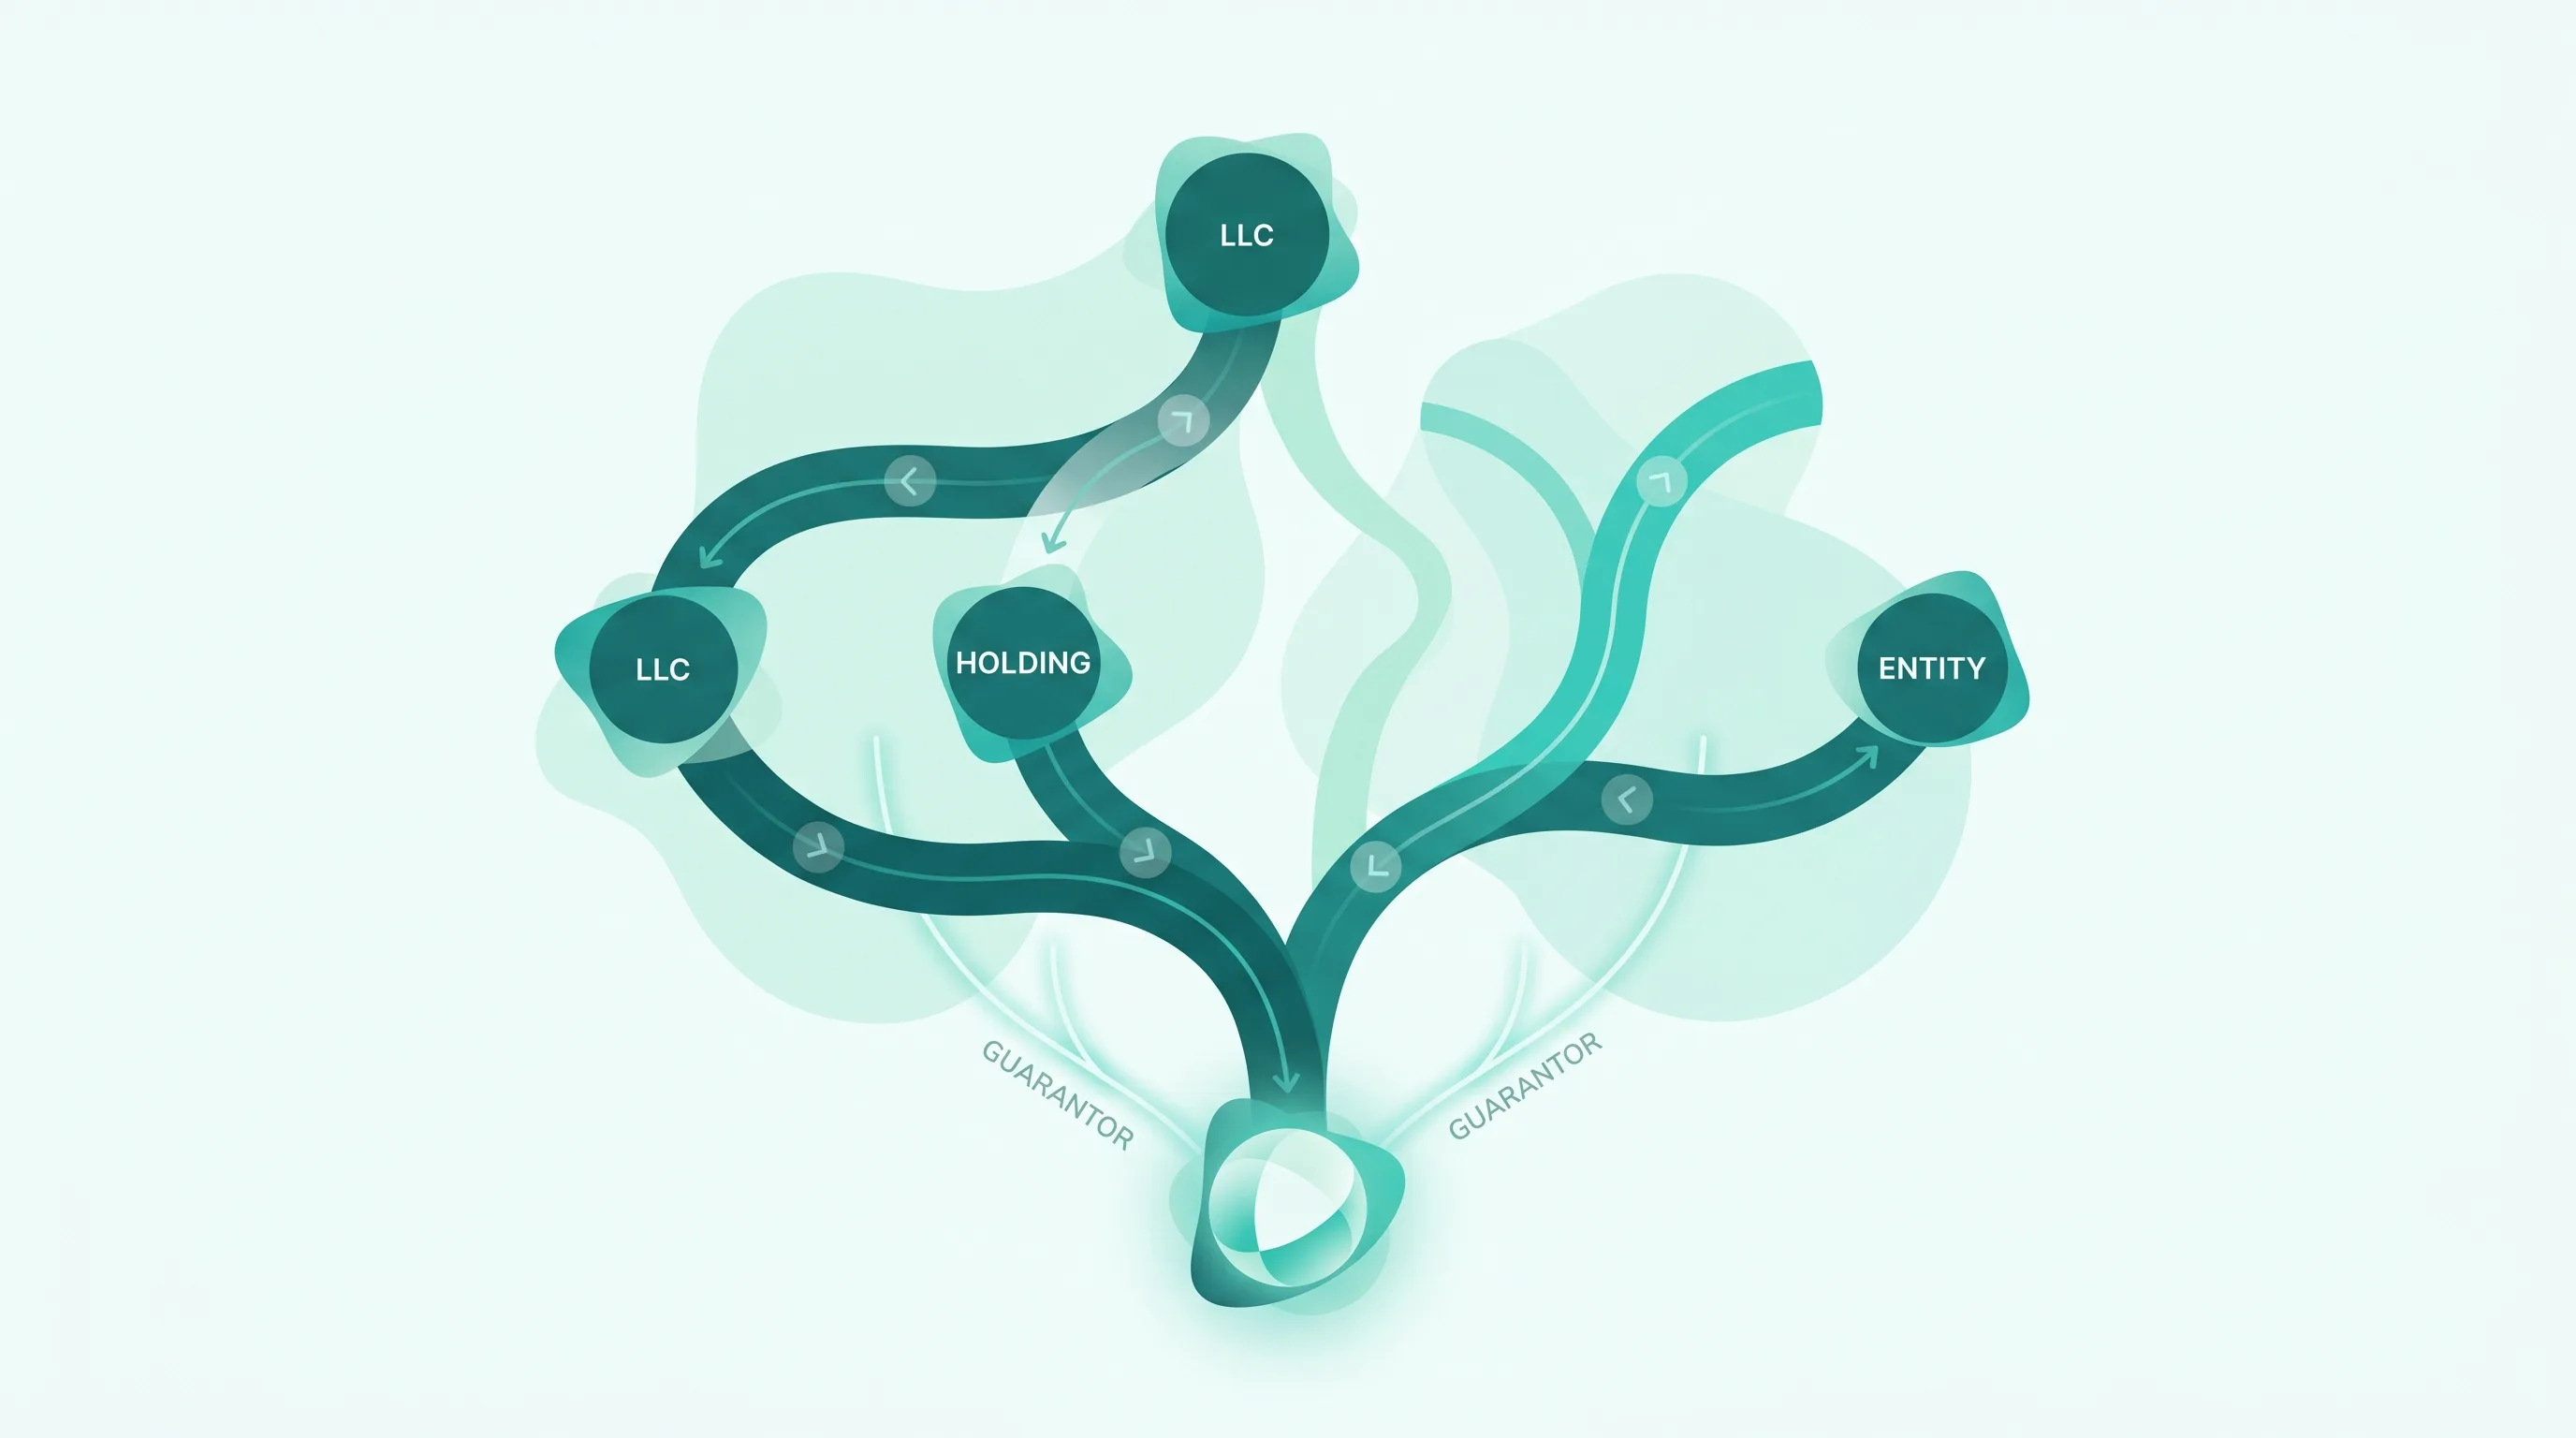
Tiered ownership changes global cash flow in commercial lending because the guarantor often owns only an indirect share of the operating entity. If the guarantor owns 40% of LLC A and LLC A owns 60% of LLC B, the guarantor's indirect interest in LLC B is 24%. That sounds obvious until the file includes multiple Form 1065 returns, several K-1s, a personal Schedule E, and distributions that do not line up neatly with allocated income.
Global cash flow breaks when the file asks the analyst to answer ownership and cash-flow questions the forms do not answer on their own. OCR can read a K-1. It cannot decide whether Box 1 ordinary income, Box 4a and 4b guaranteed payments, and Box 19 distributions should all affect cash available for debt service the same way. They should not.
A usable workflow has to do four things: build the entity graph, cascade ownership math through every tier, keep allocation and distribution treatment separate, and preserve source-page citations so the underwriter and examiner can follow every step. The broader consolidation workflow lives in the global cash flow automation guide. This page stays tight on the tiered-ownership part that breaks most teams.
Concrete example
What happens when a guarantor owns 40% of LLC A and LLC A owns 60% of LLC B?
Start with the ownership math. The guarantor does not own LLC B directly. The guarantor owns 40% of the entity that owns 60% of LLC B.
Now assume LLC B reports $500,000 of ordinary business income on its return. The K-1 from LLC B to LLC A reflects LLC A's 60% share. In this simplified example, LLC A then passes that LLC B-derived share through to the guarantor based on the guarantor's 40% interest in LLC A. In pure allocation terms, the guarantor's indirect share of LLC B's ordinary income is $120,000.
But that still does not tell you the guarantor received $120,000 of cash. The K-1 instructions separately distinguish ordinary business income in Box 1, guaranteed payments in Box 4a and 4b, and distributions in Box 19, including cash under code A. If LLC B distributed $150,000 total cash to its members during the year, LLC A's 60% share would be $90,000 and the guarantor's indirect share of that cash would be $36,000 before you make any credit-policy judgment about sustainability or overlapping debt.
| Item | What it means | Guarantor's indirect share |
|---|---|---|
| LLC B Box 1 ordinary income: $500,000 | Allocated income flowing through the ownership chain | $120,000 |
| Total cash distributed by LLC B: $150,000 | Actual cash paid out through the ownership chain | $36,000 |
Those two numbers are not additive by default. That is the whole point. One is allocated income. One is distributed cash. If an analyst counts both as free cash to service debt, global cash flow is overstated before the memo even starts.
Where do manual analysts get the tiered-ownership workflow wrong?
1. Using the wrong K-1 line for the wrong job
Box 1 is ordinary business income. Box 4a and 4b are guaranteed payments. Box 19 separately reports distributions, including cash under code A. They answer different questions. In commercial lending, that distinction matters because one line may describe operating performance, another may describe partner compensation, and another may describe actual cash movement. If the spread collapses them into one partnership-income bucket, it is wrong in a way that changes the credit answer.
2. Double-counting allocated income and distributions
This is the classic error. The guarantor's Schedule E may already reflect pass-through income from the entity. A separate statement or K-1 may show cash distributions. Analysts under deadline pressure add both, then wonder why the borrower suddenly looks over-covered. The file feels numerically consistent because every number came from a real document. The logic is still broken.
3. Missing that one K-1 points to another entity return
Tiered ownership gets ugly when a K-1 recipient is another entity, not the guarantor. That means the analyst cannot stop at one return. They need the next entity return, the next ownership percentage, and the next pass-through path. In Aloan's own shipped workflow material, this kind of three-tier tracing exercise takes about 90 minutes manually. The time sink is not arithmetic. It is graph construction in the analyst's head.
4. Treating basis-sensitive items like clean cash flow
The IRS instructions for partnership K-1 distributions note that if cash received exceeds adjusted basis immediately before the distribution, the excess is treated as gain. The same theme shows up even more explicitly on the S-corp side, where Form 7203 exists to track stock and debt basis limitations on losses, deductions, and non-dividend distributions. Credit teams do not need to become tax advisors, but they do need a workflow that flags when the tax packet itself says the treatment is basis-sensitive.
Why does generic OCR fail on global cash flow tiered ownership?
Because extraction is only the first move. A generic tool can read that a number exists on a K-1. It usually cannot answer whose number it is, which entity it belongs to, how far it should cascade, whether it already appears on the personal return, or whether the amount represents allocation, compensation, or cash. That is why the broader tax return analysis workflow has to be built around reasoning instead of template capture.
| Workflow step | Why extraction alone fails | What production software should do |
|---|---|---|
| Document classification | One packet may contain multiple entities, years, and form types | Identify form, year, and filing entity before extraction starts |
| Entity graph construction | A K-1 alone does not show the full ownership chain | Build the graph from K-1 evidence, entity names, and ownership percentages |
| Ownership cascade | The same income may pass through multiple tiers before reaching the guarantor | Apply indirect ownership math across every tier and show the rollup path |
| Allocation vs distribution treatment | The form reports both, but they should not be blended | Keep Box 1, Box 4a/4b, and Box 19 distribution lines explicit and reviewable |
| Audit trail | A clean number with no paper trail still fails review | Preserve source-page citations for every extracted or derived figure |
Timing gaps compound fast. In Aloan's shipped workflow material, a clean 1040 takes about 20 to 30 minutes to spread, a multi-entity 1065 can push past an hour, and multiple years plus tiered K-1s can stretch first-pass global cash flow into one to two working days. The useful system is the one that removes the tracing overhead, not just the typing.
What should automation actually do in a production underwriting workflow?
- Classify the packet. Separate 1040s, 1065s, 1120-S returns, K-1s, and supporting schedules by entity and year.
- Build the entity graph. Turn K-1 ownership evidence into a borrower-group map instead of asking the analyst to whiteboard it.
- Cascade the math. Apply direct and indirect percentages through every tier so the guarantor share is explicit.
- Keep income classes separate. Ordinary income, guaranteed payments, and distributions should stay distinct until policy review says otherwise.
- Reconcile with citations. Every add-back, ownership link, and flow-through result should click back to the source page.
- Flag gaps early. If a K-1 references an entity return that is not in the packet, the system should surface that on day one, not after the spread is almost done.
That is the practical case for Aloan's approach to AI-assisted underwriting. The point is not nicer form capture. The point is giving the underwriter a first-pass cash flow story with the ownership path, source citations, and open questions already visible.
Human line stays clear
The underwriter should still decide which entities belong in the global view, whether a distribution is sustainable enough to support debt service, whether an add-back is recurring, and what the final repayment story means for approval. Software can handle the tracing and reconciliation. The credit call still belongs to the lender.
If you want to see what that looks like on a live commercial file, start with the product demo and compare it to the manual process in the cascading ownership post.