In June, Gerrit wrote here about why we wouldn't quote a single accuracy number (How We Think About Accuracy). The problem he described was the answer key. Grading a spread needs the right value for every figure, and the usual source of right values is a person keying the same pages, whose own error rate is about the size of what you're trying to measure.
We've now built an answer key that doesn't depend on a person, and measured. The full report is at aloan.ai/accuracy. This post covers how the test works and what it found.
An answer key you can trust
A generator invents a company and its owners and keeps three years of books for them. It files their taxes on each year's IRS forms, prints financial statements from the same books, and records every number it prints. Each return passes the generator's own consistency checks before it's printed. Because the generator wrote every page, the right value of every figure is known before Aloan sees it.
The test has 36 companies: twelve kinds of business, each generated three times with different names, figures, owners, tax software and statement styles. That's 288 tax returns and 168 financial statements. Because every company is new, Aloan can't have learned the answers in advance.
One borrower, five tax returns
Income reaches the owners through a holding company and a family trust. Each arrow is a K-1, and each one has to match the return it came from and the return it lands on, three years running.
Part II and Part III are the sections of each owner's Schedule E where the K-1 is reported. Names are invented fresh every time the test is generated.
Files as messy as real ones
Real loan files are messy, so we made the test files messy in the same ways:
- Totals on the form with the items on a statement page at the back of the return ("See Statement 1" on page 1, the detail on page 13).
- Three different tax programs' layouts, each with its own headers and way of pointing to a statement.
- Two-year comparison reports and QuickBooks exports that print last year's figures beside this year's.
- Financial statements that are CPA-reviewed, compiled, QuickBooks exports, company-prepared, spreadsheets and interim year-to-date.
- Depreciation printed on the face, buried in a schedule four pages back, or shown only on the cash flow statement.
- Owners paid through a holding company and a family trust, rental real estate on Form 8825, farms on Schedule F, sole proprietors on Schedule C, nonprofits on Form 990.
Every document was read clean, as a photocopy, and as a light and a heavy phone photo. Each level was tuned so a person can still read every figure.
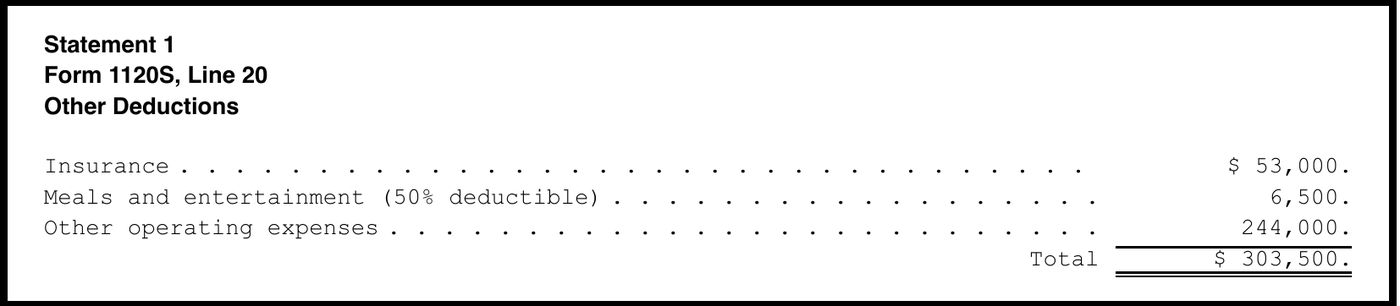
The total is on page 1. The items are on page 13.
Aloan has to find the statement, read each item and check that they add up to the line.
Form 1120-S, page 1

Statement page, page 13 of 16
Four questions, measured separately
A credit officer asking how accurate a tool is wants to know four things: whether it read the number, whether they'll know when it's wrong, whether it's the same every time, and whether any of it changes the decision. A single percentage answers the first. We report all four.
Reading the number. On clean files Aloan read 54,744 figures. 11 were wrong and 17 came back blank, so 99.98% of figures were read correctly. On phone photos the rate was 99.87%. We count blanks separately because a blank is an empty cell the underwriter can see, while a wrong figure looks like any other number. Of 288 tax returns, 286 had no wrong figure on any of three reads.
Same borrower, four kinds of paper
Wrong figures and blanks per 10,000 figures read. A blank is an empty cell the underwriter can see. A wrong figure looks like any other number.
Clean PDF
1 in 5,000 wrong
Photocopy
1 in 3,400 wrong
Phone photo, light
1 in 660 wrong
Phone photo, heavy
1 in 860 wrong
Knowing when it's wrong. We changed one printed number in each of 279 documents, the way people slip. Aloan flagged 236 with a failed check and auto-corrected 18 from the books. 10 more got an advisory note for the analyst, and 15 got through: 2 of 135 on tax returns and 13 of 144 on financial statements, which offer far fewer independent ways to prove a figure. Across the tax returns, 9,377 of 9,430 figures Aloan keeps (99.4%) take part in at least one check.
We planted 279 typos. 15 got through.
One changed figure per document, the way people slip: transposed digits, a dropped or doubled digit, a neighboring figure copied.
Tax returns · 135 planted · 2 not caught
Financial statements · 144 planted · 13 not caught
The same every time. Each file was read three times, independently. 99.95% of figures came back the same way all three times.
The decision. We rebuilt DSCR (against 1.20x), pro forma leverage (against 3.0x) and global cash flow (against 1.25x) from every read: 1,728 outcomes across re-reads and damaged copies. None landed on the other side of its line, although the test deals sit close to their lines on purpose.
0 of 1,728 credit outcomes changed
We rebuilt DSCR, leverage and global cash flow from every read and checked whether any landed on the other side of its line.
| Measure | Re-reads that flipped | Damaged copies that flipped |
|---|---|---|
| DSCRagainst 1.20x | 0 of 297 | 0 of 297 |
| Leverageagainst 3.0x | 0 of 270 | 0 of 270 |
| Global cash flowagainst 1.25x | 0 of 297 | 0 of 297 |
The test deals sit close to their lines on purpose: DSCR runs from 0.93x to 1.71x, and 6 of the 99 borrower-years fail.
Compared with people
No study has published a per-figure error rate for bank analysts spreading tax returns. The closest evidence comes from other fields where people copy numbers from paper: single entry from a structured form runs about 0.29% per figure, and double entry, with two people keying and reconciling, about 0.14%. Aloan's rate on clean files was 0.02%, and 0.13% on phone photos. Those studies include dates, codes and text, and ours are numbers graded to the dollar, so treat this as a rough comparison.
A bank can measure its own rate. Pick about 40 recent deals, have two analysts spread each one independently, and have a third check every disagreement against the page. That gives a per-figure error rate to within about a quarter of a percentage point.
What to ask any vendor
These are the questions we'd put to anyone's AI spreading, ours included:
- Accuracy of what, and out of how many? Figures, fields or documents, and on which forms?
- Wrong or blank? How often is a figure wrong without anyone being able to see it?
- On what paper? Clean PDFs, or the photocopies and phone photos your bank receives?
- Of the errors already in the borrower's documents, how many does it flag?
- How often would a misread have moved a DSCR across your line?
The full report, with every table and examples of the pages we tested on, is at aloan.ai/accuracy.
FAQ: Aloan's accuracy
How accurate is Aloan?
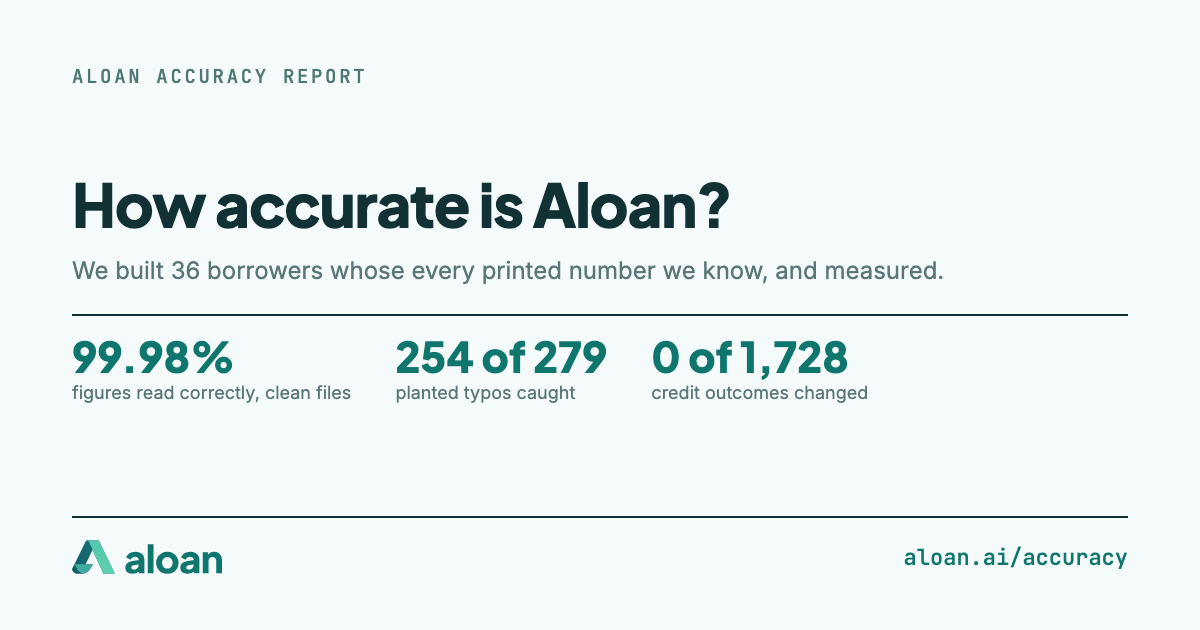
On a test of 36 synthetic borrowers whose every printed number is known, Aloan read 99.98% of figures on clean files correctly (11 wrong out of 54,744) and 99.87% on phone photos. It flagged or auto-corrected 254 of 279 mistakes planted in the borrowers' documents, returned the same value for 99.95% of figures across three independent reads, and no re-read or damaged copy changed a DSCR, leverage or global cash flow outcome (0 of 1,728). The full report is at aloan.ai/accuracy.
How did Aloan measure accuracy without a human answer key?
A generator invents each borrower, keeps three years of books, files the tax returns on each year's IRS forms and prints the financial statements, recording every number it prints. Because the generator wrote every page, the right value of every figure is known before Aloan reads it.
Does Aloan's accuracy hold up on photocopies and phone photos?
Every test document was also read as a photocopy and as a light and a heavy phone photo. On clean files about 1 in 5,000 figures came back wrong; on phone photos, about 1 in 770. No damaged copy changed a credit outcome.
What does Aloan miss?
Of 279 mistakes planted in the borrowers' documents, 15 were not caught: 2 of 135 on tax returns and 13 of 144 on financial statements, which give fewer independent ways to prove a figure than a tax return.